Dashboard
The dashboard answers three questions at a glance: where the money is, where it goes, and what is coming.
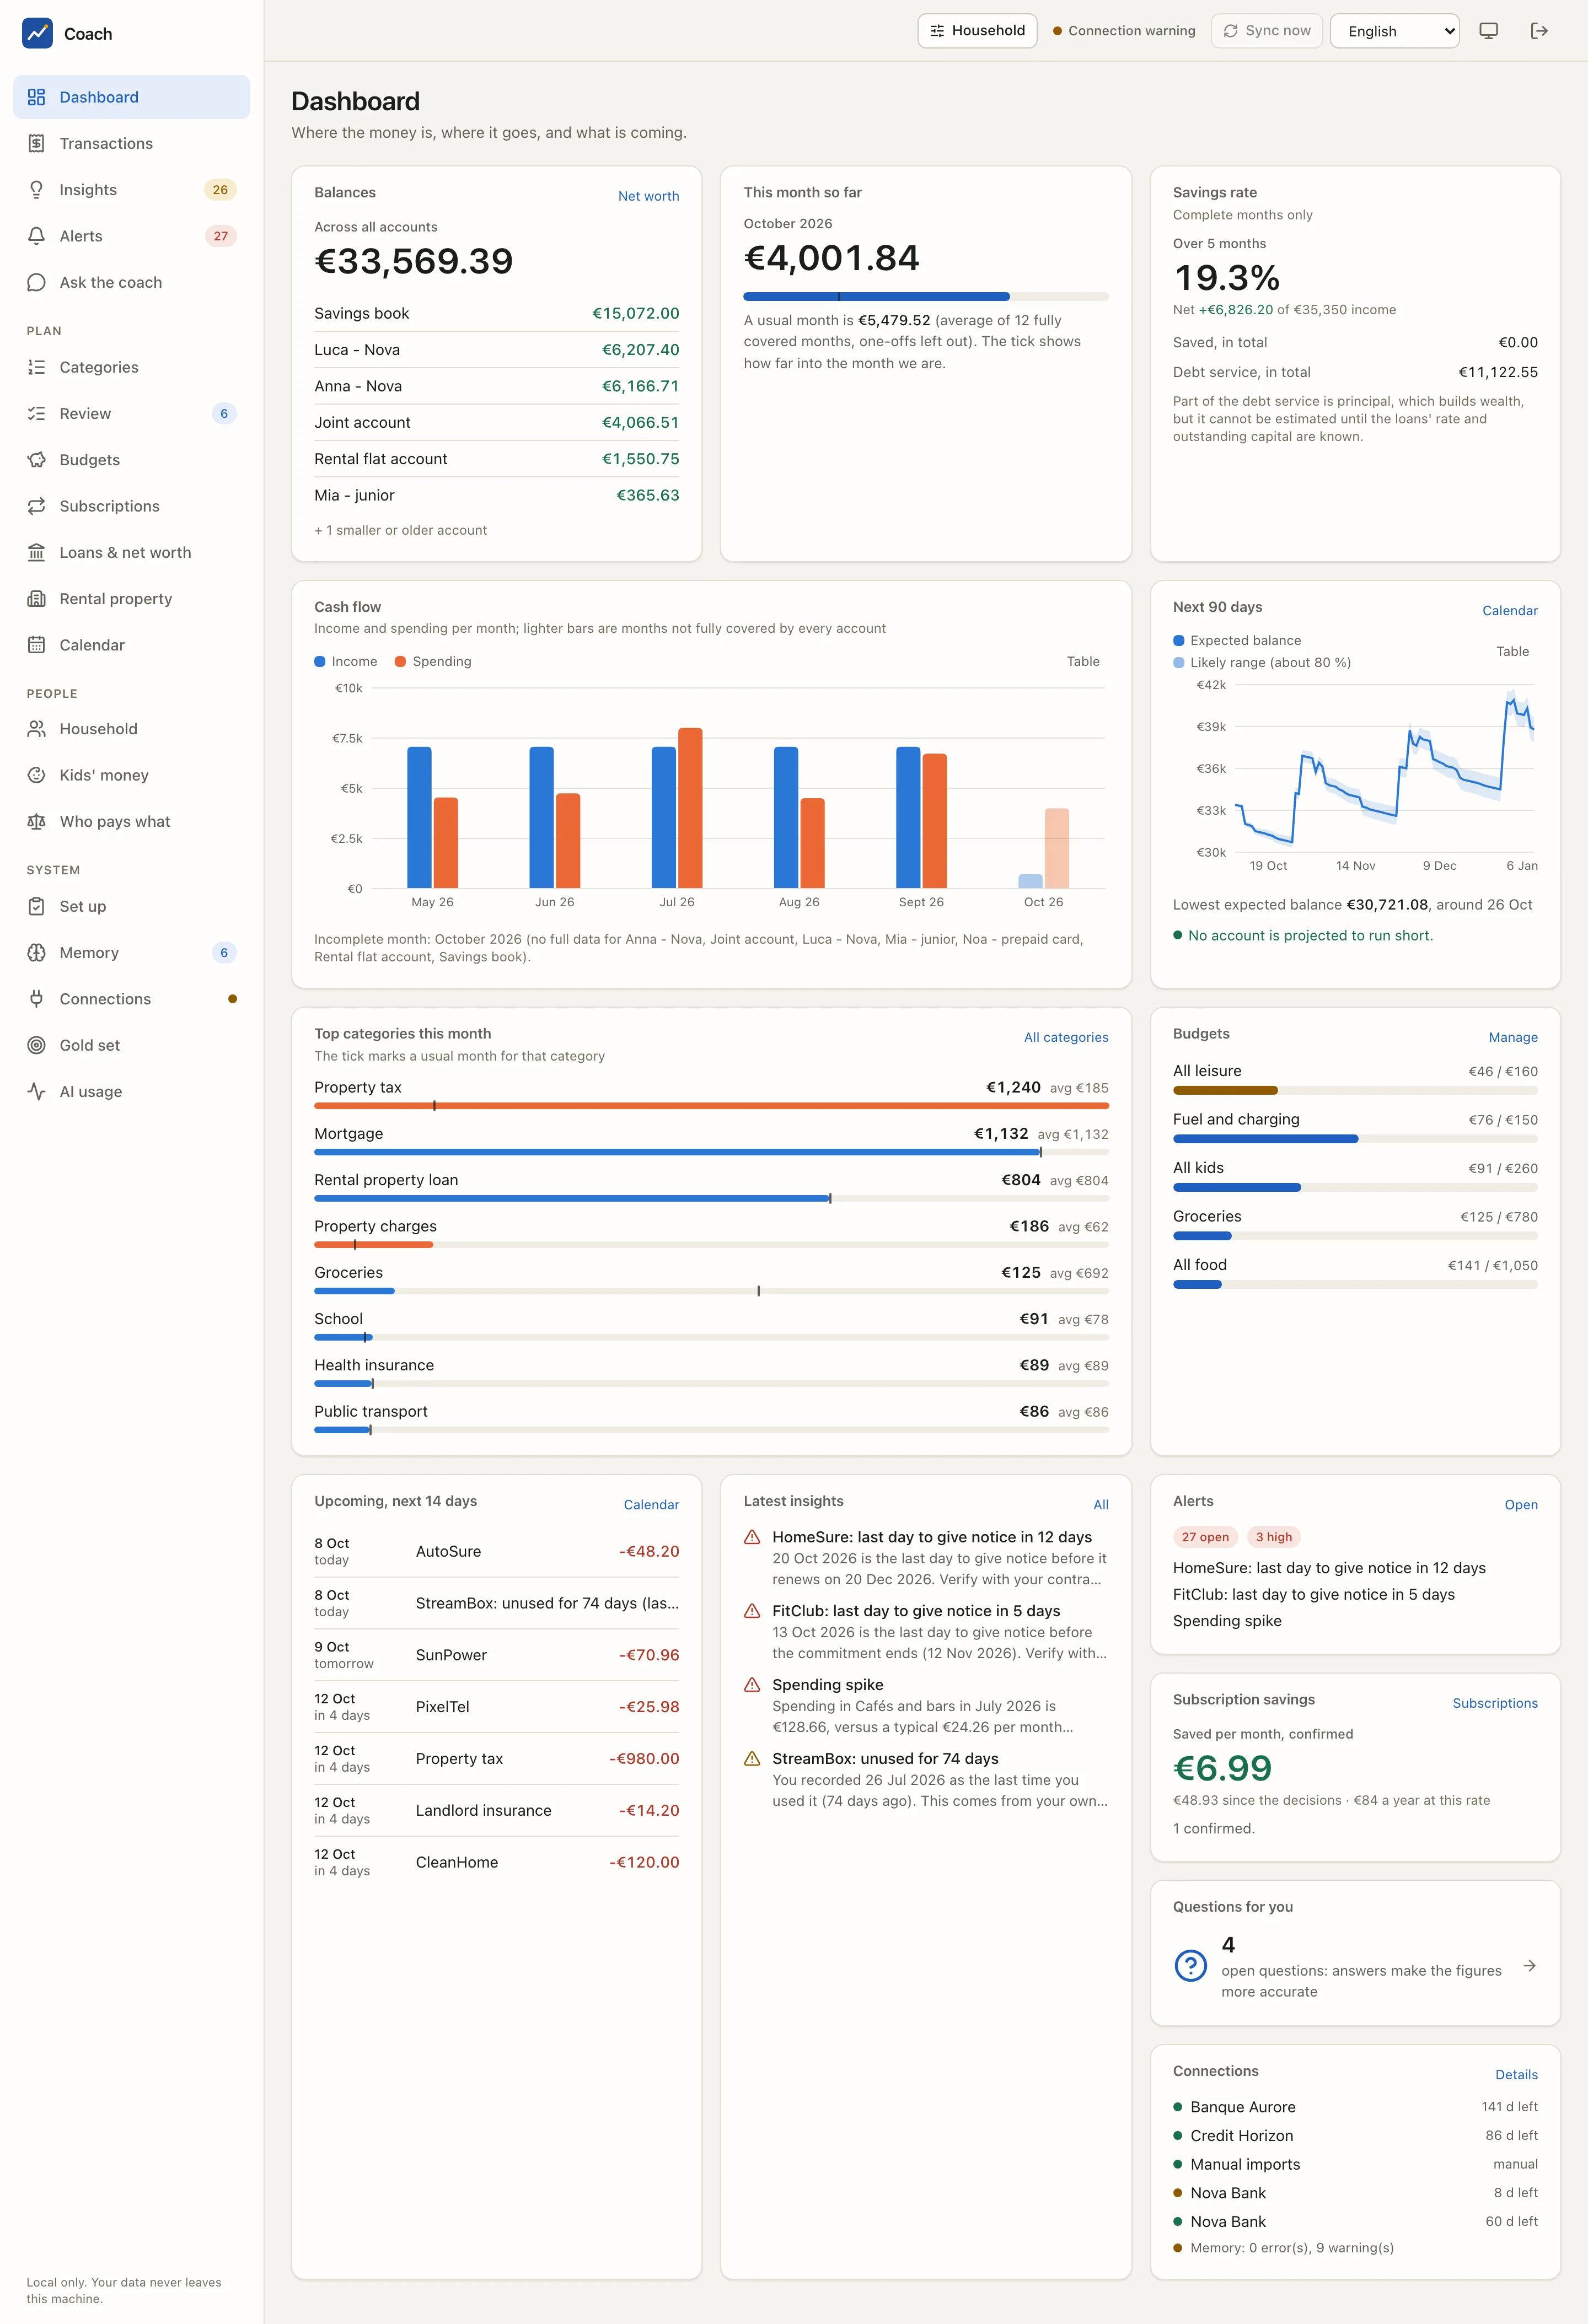
Every figure on this page comes from the analytics engine, the same code the coach and the CLI use. The page only formats it. Most cards have a link in their corner to the page with the full story.
What you see
Balances
The balance of each account and the total Across all accounts. The app takes the most "booked" balance the bank gives; when a bank only gives another kind (an available balance, for example), the type is shown next to it and the total says it mixes types. Small or old accounts are folded into "+ 1 smaller or older account". Net worth opens Loans & net worth.
This month so far
What the household spent since the 1st, with a bar against a usual month: the average of the months fully covered by every account, one-offs left out. The tick on the bar shows how far into the month you are, so you can see at once whether spending runs ahead of the calendar.
Why \"fully covered\" months?
Your accounts do not share the same history: one bank may give two years, another a few months. Dividing a total by 12 when one account only has 7 months would understate the average. A month counts only when every account that carries income or spending has all its days. See the coverage model.
Savings rate
Computed on complete months only: the rate, the net amount against the income, what was Saved, in total (money tagged savings or investment) and the Debt service, in total.
Part of a loan instalment is principal, which builds wealth. When the loans' rate and capital are known, the card adds the rate including that principal. When they are not, it says so ("it cannot be estimated until the loans' rate and outstanding capital are known") instead of guessing. Recording your loans on the Loans & net worth page fills it in.
Cash flow
Income and spending per month, as bars. Lighter bars are months not fully covered by every account, and the note under the chart names the accounts that miss data for them (the month in progress is always one of them). Table shows the same numbers as a table.
Next 90 days
The forecast of your balance: the Expected balance line and the Likely range (about 80 %) band around it. It is built from the recurring payments, loan instalments and your usual variable spending. Under the chart: the lowest expected balance and its date, and either "No account is projected to run short." or a warning that an account could run short around a date. The warning appears as soon as the low end of the band goes below zero, before the expected line does. Calendar opens the Calendar.
Top categories this month
This month's biggest categories, each with a bar. The tick marks a usual month for that category, and "avg" gives its value. A bar past its tick is a category running above its habit. All categories opens Categories.
Budgets
Your envelopes with how much is used ("€125 / €780"). Manage opens Budgets & goals.
Upcoming, next 14 days
The payments expected in the next two weeks: subscriptions, insurance, loan instalments, taxes, with the date and the expected amount.
Latest insights
The newest cards of the Insights feed: a notice deadline coming up, a spending spike, a subscription you recorded as unused. All opens the feed.
Alerts
The count of open alerts and of high-severity ones, with the latest titles. Open goes to the Alerts page.
Subscription savings
What your recorded decisions (a cancellation, a renegotiation, a switch) save per month, confirmed by the bank data, and how much since the decisions. A decision you recorded but that the bank data does not confirm yet is shown apart. See Subscriptions & contracts.
Questions for you
How many open questions the coach has about your household ("answers make the figures more accurate"). The arrow opens the inbox in Memory.
Connections
Each bank with the days left on its consent, manual imports, and the result of the memory check (errors and warnings). Details opens Connections.
Everyday use
- Morning glance: this month against the tick, the lowest expected balance, and the upcoming payments.
- Narrow to one person: use Household in the top bar. Balances, cash flow and categories then show only what is attributed to that person.
- Before a big purchase: look at the forecast band. If the low end gets close to zero, ask the coach a what-if question.
Numbers come from code, words come from the model
Nothing on the dashboard is written by an AI. The coach reads the same computed results and only explains them.
From the terminal
| Card | Command |
|---|---|
| This month, usual month | uv run coach averages |
| Cash flow, savings rate | uv run coach cashflow --months 6 |
| Next 90 days | uv run coach forecast |
| Upcoming | uv run coach calendar --days 14 |
| Budgets | uv run coach budget status |
| Coverage of each account | uv run coach coverage |
See also
- Analytics reference: how every figure is computed.
- Web app reference: the pages and the API.