Trends
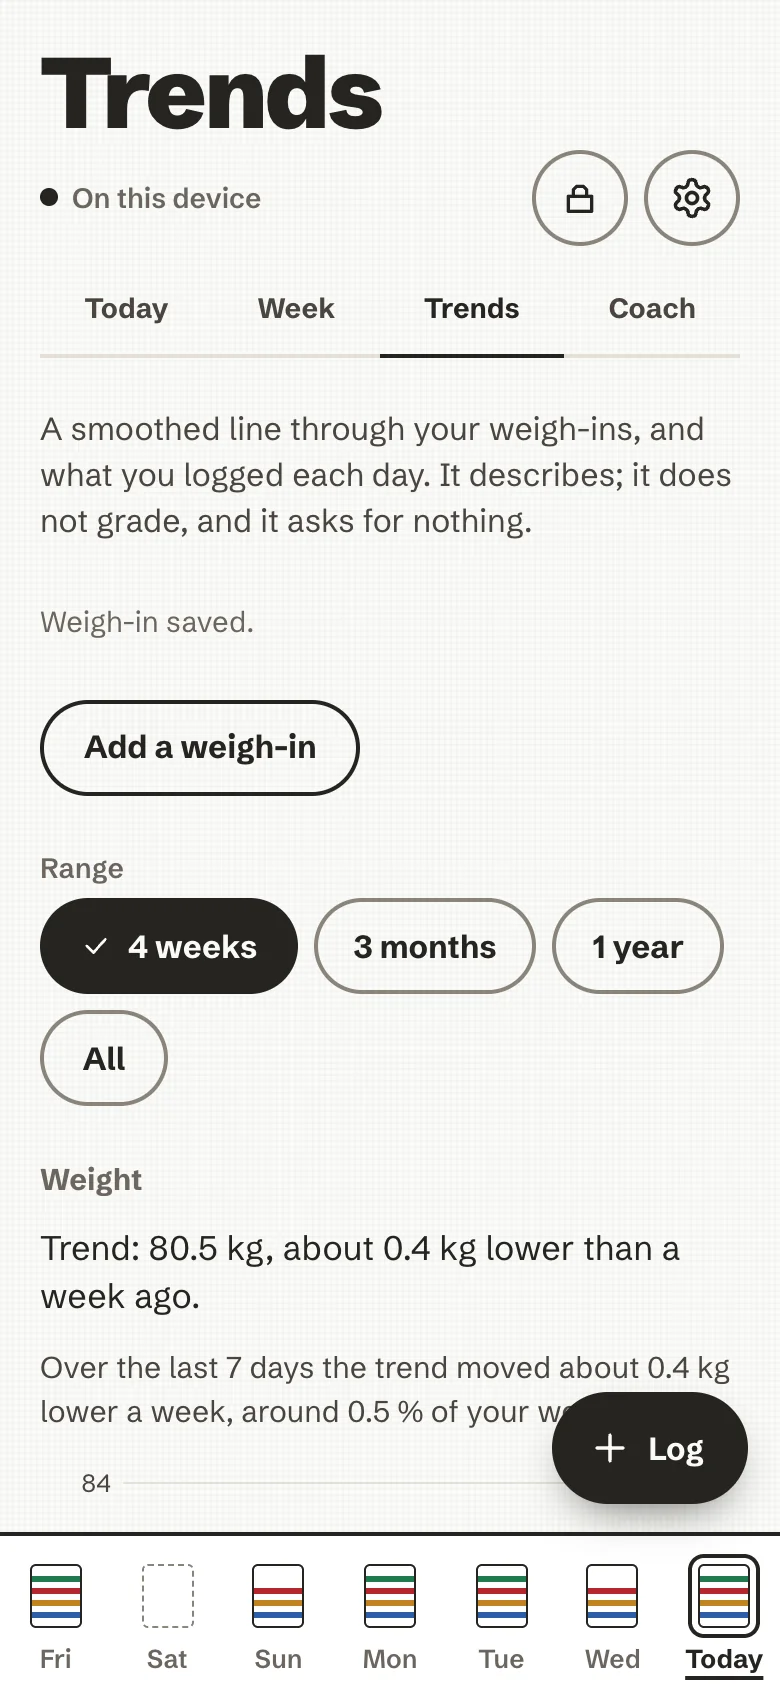
Trends keeps the longer view: your weigh-ins, a smoothed line through them, and what you logged each day. It describes; it does not grade. There is no target weight, no streak, no reminder and no colour for better or worse. Everything on it is optional, and it works the same way on a phone and on a computer (in the rail, or the Trends tab under the header on a phone).
Weigh-ins
Add a weigh-in is on Today (a quiet link under the day's nutrition) and on Trends. The sheet (Save stays in view while the form scrolls) asks for:
- The day. Today by default, any earlier day, never a later one.
- Your weight, in the units you chose in Profile (kg or lb). A decimal comma is fine.
- Your waist, if you want to record it the same day.
One line says how to weigh yourself so the numbers compare: the same scale, in the morning, before eating; a change of a kilo or so from one day to the next is mostly water. There is one weigh-in per day: a second one for the same day replaces the first, and the sheet says so before you save. The calm support line sits in the sheet too.
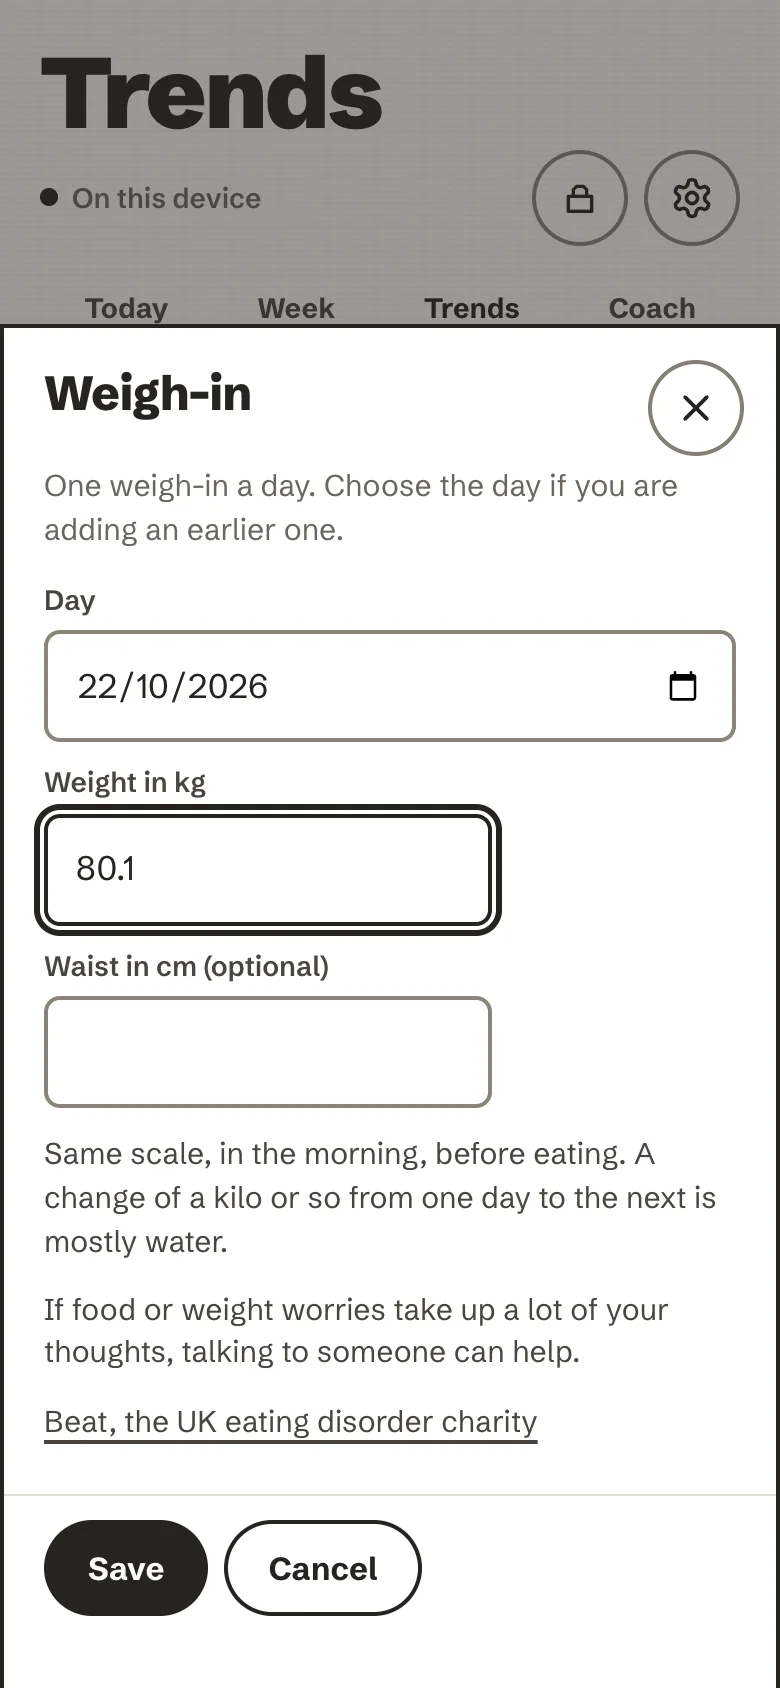
Two small protections against a slip of the finger. If a weight you type differs from your last weigh-in by more than 10 % or 5 kg (whichever is larger), the sheet (and Profile, and the welcome) asks once, without repeating any figure: "That is quite different from your last weigh-in. Save it as typed?", with Save and Change it. And if you edit an entry and change its date, it moves: the entry of the original day is removed with it. Removing an entry asks for a yes first, and an empty date says "Please choose a date."
The app never reminds you to weigh yourself and never says you have not. Under Weigh-ins on Trends, every entry can be edited or removed. Your waist has its own list, and when there are two or more values, one plain line says the first and the latest.
The trend
A weigh-in swings by a kilo or so from day to day with water, so the line on the chart is a trend: an exponentially weighted moving average on calendar days (each day it moves 10 % of the way towards a new weigh-in). Days without a weigh-in are not invented: the trend is carried across them, and after a long gap the next weigh-in counts for more. The first value is its own trend.
A weigh-in that differs by more than 15 % from the median of the ones around it (up to three before and three after, and at least three of them) is taken for a typing slip, such as 182 for 82 kg: it is left out of the trend, the pace, the safeguard and the chart's axis. It is not deleted: it stays in your list and in the table, marked "not used for the trend", with its Edit action.
In words, never as a verdict: "Trend: 81.6 kg, about 0.4 kg lower than four weeks ago." A change over a week needs two weigh-ins at least seven days apart, and over four weeks at least three weeks apart; with fewer, the page says what it has and that a trend needs a few more. The comparison uses the real span between the points compared: if no weigh-in lies within three days of the start of the window, it is made with the nearest earlier weigh-in and says how far back that was ("about 5.0 kg lower than 60 days ago"). A second line gives the pace over that same span in kg per week and as a percentage of your weight.
The chart is a small line drawing in one ink: the trend as the line, your weigh-ins as faint dots, ticks by the week. Its labels are 12 px or larger on a 336 px wide phone, and over a range longer than 180 days it draws one dot a week. Its vertical axis is never narrower than 4 kg or 5 % of your weight, so a 300 g change does not look like a cliff. A range switch chooses 4 weeks, 3 months, 1 year or all. The same numbers are in a table behind Weigh-ins and trend as a table (the latest 60 rows, with Show all), and a gap of two weeks or more is drawn dashed and mentioned. Nothing moves.
When the weight falls quickly
If the trend falls faster than about 1 % of your body weight a week over the last 14 days, one calm line appears. It needs enough to go on: your first weigh-in at least 28 days ago (the first weeks of a new routine are mostly water), at least three weigh-ins spanning at least 14 days within the last 28 days (one a week is enough), and a latest weigh-in no more than 14 days old, so the line never outlives its data. It is shown in three places, on Trends, next to your daily guide in Profile and on Today, and also with nutrition numbers hidden (it is a safeguard, not a figure): "Your weight is going down faster than about 1 % a week. A slower pace is easier to keep and kinder to the body; consider a gentler pace in Profile, or talk to a doctor or a dietitian." It links to the pace choice, it is the same ink as everything else, and you can hide it for 14 days. It does not depend on your goal. The 1 % figure is a convention, not a clinical threshold (see ADR 0008).
Your daily guide follows your latest weight
The guide is worked out from your latest weigh-in. How this is worked out in Profile names the one it used and its date. If that weigh-in is older than 60 days, a quiet line suggests updating it. Weight, trend and waist are never sent to an AI.
What you logged
What you logged lists energy and protein for each day of the range, newest first, against your daily guide (the tick, drawn as in the nutrient bars: one neutral colour, the value always in text). A day with nothing logged is left empty, not shown as zero; a total that leaves a food out reads "at least". The list reads at most the last 90 days. Tap a day to open it on Today.
With numbers hidden
If you turned off Show nutrition numbers, the chart, the trend and the totals are hidden too. You can still add, edit and remove weigh-ins; they are named by their date and no figure is shown back.
Where it is stored
Weigh-ins are the dated measurements described in Settings → Profile: encrypted, synced with your vault if you use sync, in the JSON and CSV export as raw values, and erased by Remove all measurements or Erase all local data. The trend and the pace are worked out on the screen and never stored or exported.