Nothing leaves the pad until you say Go.
Paeon sits next to your alerting. A cheap model triages, a strong model investigates with tools that can only read, and then it asks you. Plain code does the rest, from a closed catalog of actions.
Self-hosted · Apache-2.0 · alpha. Out of the box it takes no action on your server.
Incident #3 · slo_traefik_5xx · server-1
Simulated- Recordtwo alerts, as they cameGo
- Correlatesame host, seconds apart: one incidentGo
- Triagereal, 86% sureGo
- Investigatemedia-server lost its database connectionsGo
- Plan
restart_container(media-server)Go - Youwaiting for your answerHold
- Executornothing runs without GoStandby
The poll holds on you. Lift the guard, then answer.
The poll, station by station
An incident is called through these stations. Each one has a single voice: code that records, a model that only thinks, or you.
Record
CodeOpenObserve, uptime-kuma and anything that speaks the Alertmanager webhook. Every observation becomes one event in an append-only SQLite log. Paeon gets a copy: it is never in the path of your alerts.
Correlate
CodeThe same alert firing again is the same incident. Alerts on the same host within minutes join it. Flapping and maintenance windows are flags, and nothing is dropped.
Triage
ModelOne call to a cheap model, with no tools: noise, transient, known issue or real. Recorded in shadow mode, so nothing acts on it. A model that is down, unsure or over budget means the incident is treated as real.
Investigate
ModelA strong model with tools that can only read, each behind an allow-list you wrote: logs and metrics in OpenObserve, container state and logs through a Docker proxy, your runbooks and past postmortems. It hands in a root cause, and every claim is tied to the tool call behind it.
Runbook
CodeA known alert with a known fix skips both models and goes straight to the executor: fast, free and deterministic. If its steps do not fix it, the investigator gets the incident.
Plan
CodeA plan is a list of actions from the closed catalog, proposed from the analysis or from a runbook. Anything in the analysis that is not a catalog action stays a sentence for you.
You
YouGo or No-go, on your phone. The button is a signed link from the executor: it works once, for thirty minutes, for that exact plan. Opening it never applies anything. No answer means nothing happens.
Executor
CodeA second process with its own credentials. It checks the plan against its own copy of the rules, takes a lock, applies the step, waits for the container to be running and healthy, and rolls back where there is an inverse.
Postmortem
ModelOnce the incident has stayed resolved, a markdown draft: the timeline comes from the event log, a model writes the prose, and the file says status: draft until you review it.
Flight rules
Paeon assumes that alert text and log lines are written by an attacker, and that the model will eventually be wrong. These rules hold either way.
- The model proposes. Code disposes.
- No shell, no free-form command and no write credential for a model, in any stage. The only part of its output that code can ever run is a step that names one catalog action on one allowed container.
- Two processes. Two sets of keys.
- The core reads untrusted text and talks to models, so it holds nothing that can act. The executor holds the one write credential, and believes only its own rules and a link you tapped.
- Tools only read.
- A log stream, a metric or a container you did not list cannot be read. What is read is bounded, scrubbed of secret-shaped strings and recorded in full.
- Triage fails open.
- A spent budget never hides an alert. Budgets per incident and per day, a storm guard per hour, limits on tool calls and time.
- Never in the path.
- Your existing notifications stay exactly as they are. Run Paeon next to your alerting, never instead of it.
- Everything is an event.
- Every alert, decision, model call with its cost, and tool result is one line of the log. Incidents, the digest, the console and postmortems are read from it.
Four levels, and you set the dial
Acting is off until you add the executor on purpose. Then each alert, action and container gets a level, in your rules file. Turn the dial to see what each one does.
Suggest
Paeon tells you what it would do, with no button. The plan is in the analysis; running it is up to you.
What runs: nothing
Auto is earned, one action at a time
After five approved, verified runs in a row of the same action on the same container for the same alert, Paeon shows the policy line that would let it run alone. Adding it is your commit. One failure, one Undo or one “This was wrong” takes it back, and a kill switch drops everything to observe.
Hold Built and covered by tests, not yet proven in long use on a real server.
The catalog is closed
Six actions exist. Your rules file switches them on for the targets you name; it cannot add one. Anything else in a plan stays a sentence for you.
Action catalog · six positions
restart_containerRestart one container you listed.In catalogstart_containerStart one that stopped.In catalogunpause_containerUnpause one that was paused.In catalogreattach_network_aliasPut a container back on its network alias.In catalogcoolify_restartRestart a Coolify resource you named.In catalogconfig_changeNever applied: one existing value of one YAML file becomes a pull request. Merging it is the approval.Proposed- Position sevenThere is no seventh switch, and no way to wire one from a prompt.Blanked
Watch one incident, from the alert to the fix
Three short videos, drawn in your browser frame by frame over a synthetic voice, with subtitles and chapters. Every incident in them is fictional.
On a phone, use Fullscreen and turn it sideways.
The record, rendered
The console is the event log made readable: what was taken into account, which model or tool was called and why, what it cost, and what was sent or done. It can stop automation. It cannot approve a plan.
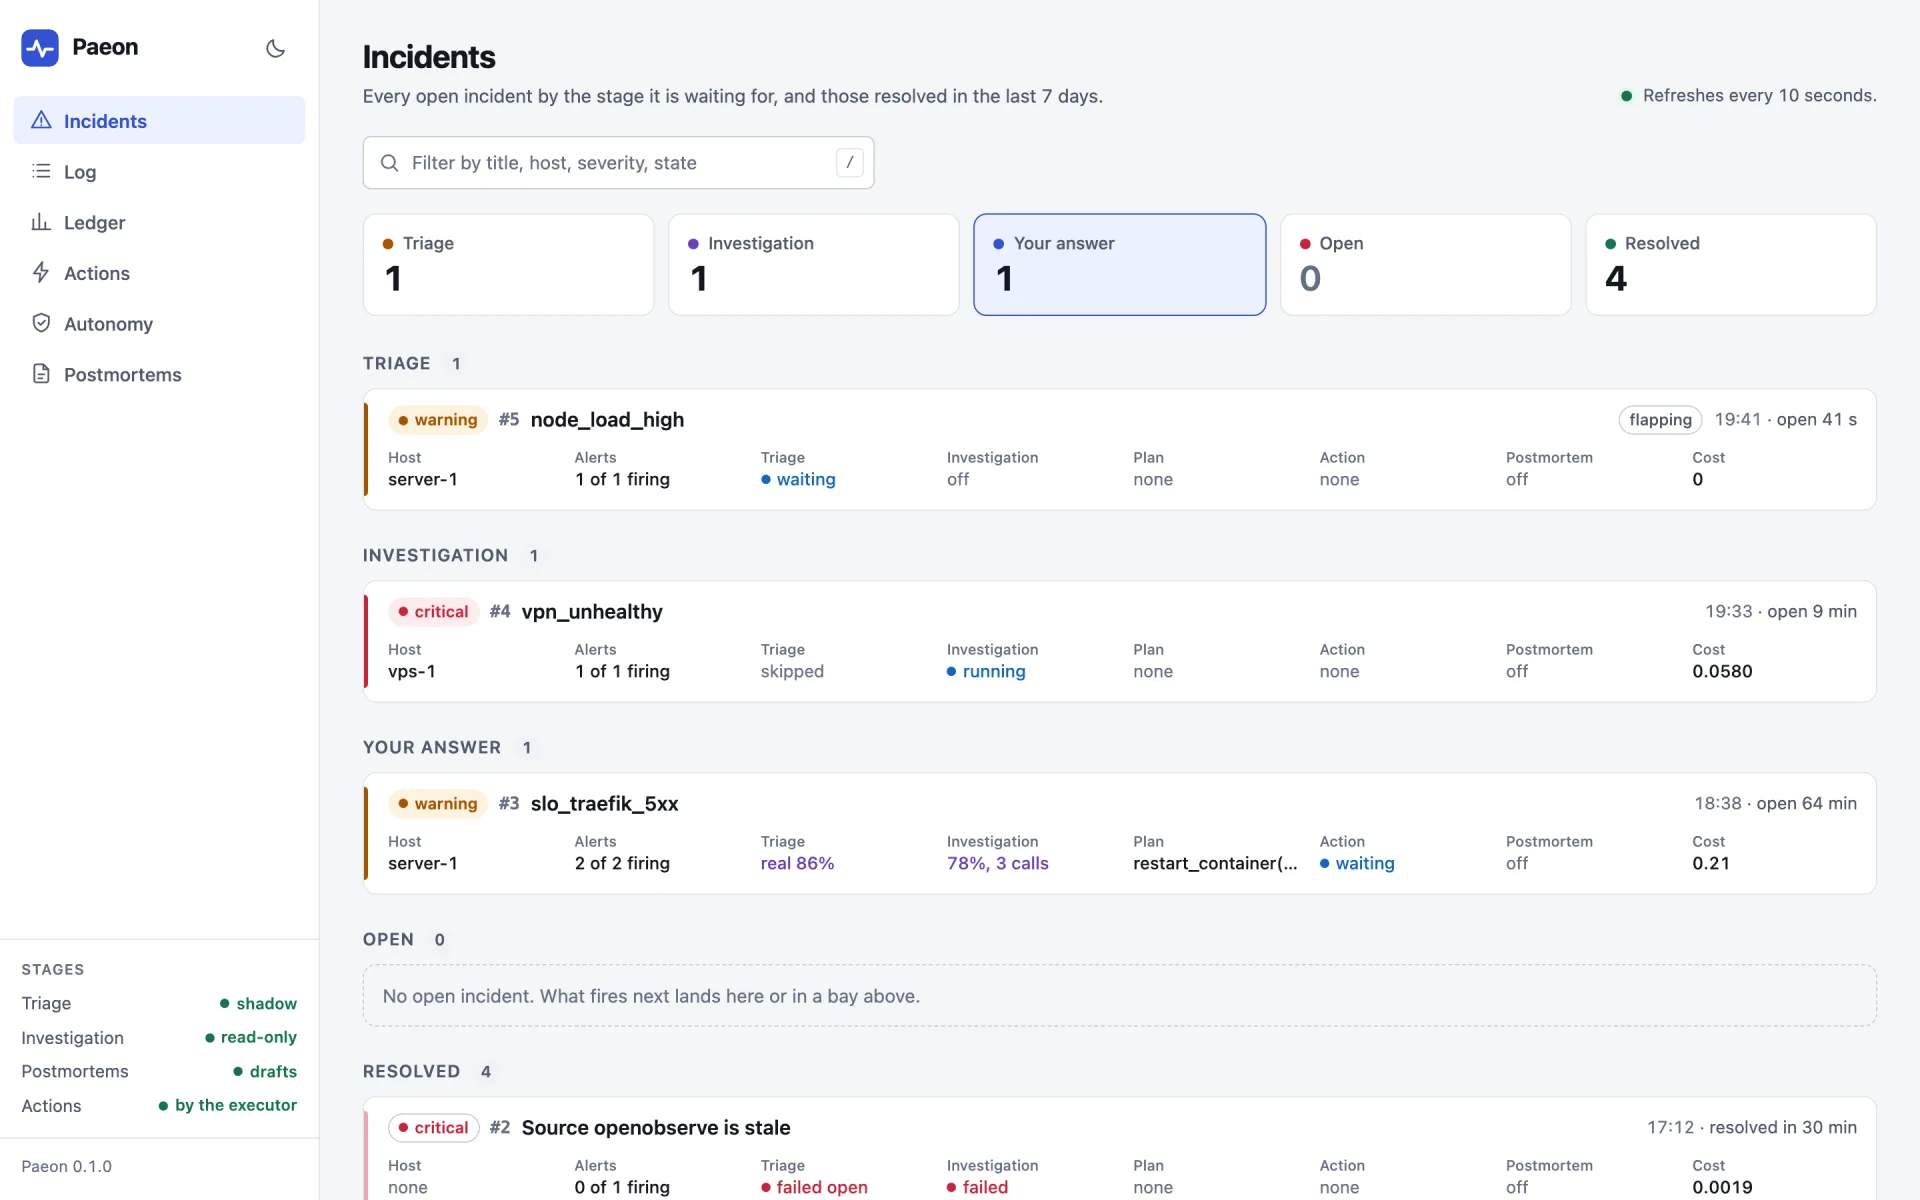
Count down to a first incident
Six steps on one machine, with Python 3.12 and uv. No account, no model key. Nothing leaves your machine: without a rules file that enables a stage, Paeon calls no model.
- T-5
Get it
git clone https://github.com/mmornati/paeon.git && cd paeon && uv sync - T-4
One secret, and the console on
echo "PAEON_INGEST_TOKEN=$(python3 -c \
  'import secrets; print(secrets.token_urlsafe(32))')" > .env
printf 'ui:\n enabled: true\n' > paeon.yaml && echo "PAEON_CONFIG=paeon.yaml" >> .env - T-3
Start it
set -a && . ./.env && set +a && uv run paeon serve - T-2
Send a first alert, from a second terminal
set -a && . ./.env && set +acurl -X POST http://127.0.0.1:8080/ingest/alertmanager \ -H "Authorization: Bearer $PAEON_INGEST_TOKEN" \ -H 'Content-Type: application/json' \ -d '{"alerts": [{"status": "firing", "fingerprint": "demo-disk-full", "labels": {"alertname": "DiskFull", "severity": "warning", "instance": "server-1"}, "annotations": {"summary": "/ is 95 % full"}}]}' - T-1
Read what it recorded
uv run paeon incidents - T-0
Open the console
The incident is waiting at
http://127.0.0.1:8080/ui.
The quickstart, step by step With Prometheus, Alertmanager and Docker
Hold points
What is not there yet, said plainly.
- Hold
Alpha. Everything on this page is written and covered by tests. The acting part has not yet run on a real server for long.
- Hold
One Docker host. Actions reach one Docker host, the Coolify instance and the deployment repository you configure. Nothing on another host, on the network or on Kubernetes.
- Hold
One channel. Notifications go to ntfy and nowhere else.
- Hold
No login. The console is off by default and belongs behind a reverse proxy that authenticates.
- Hold
A model can be confidently wrong. Read the evidence, not only the conclusion, and set the budgets before you point Paeon at a noisy source.